
In the digital age, user experience (UX) has transcended guesswork and intuition. The rise of data-driven UX design marks a shift toward precision, where every decision—from button placement to color schemes—is rooted in empirical evidence. By harnessing analytics, designers and developers decode user behavior, transforming raw data into intuitive interfaces that resonate deeply. This approach doesn’t just refine aesthetics; it builds bridges between user needs and business goals, fostering loyalty and driving growth.
The Pulse of User Behavior
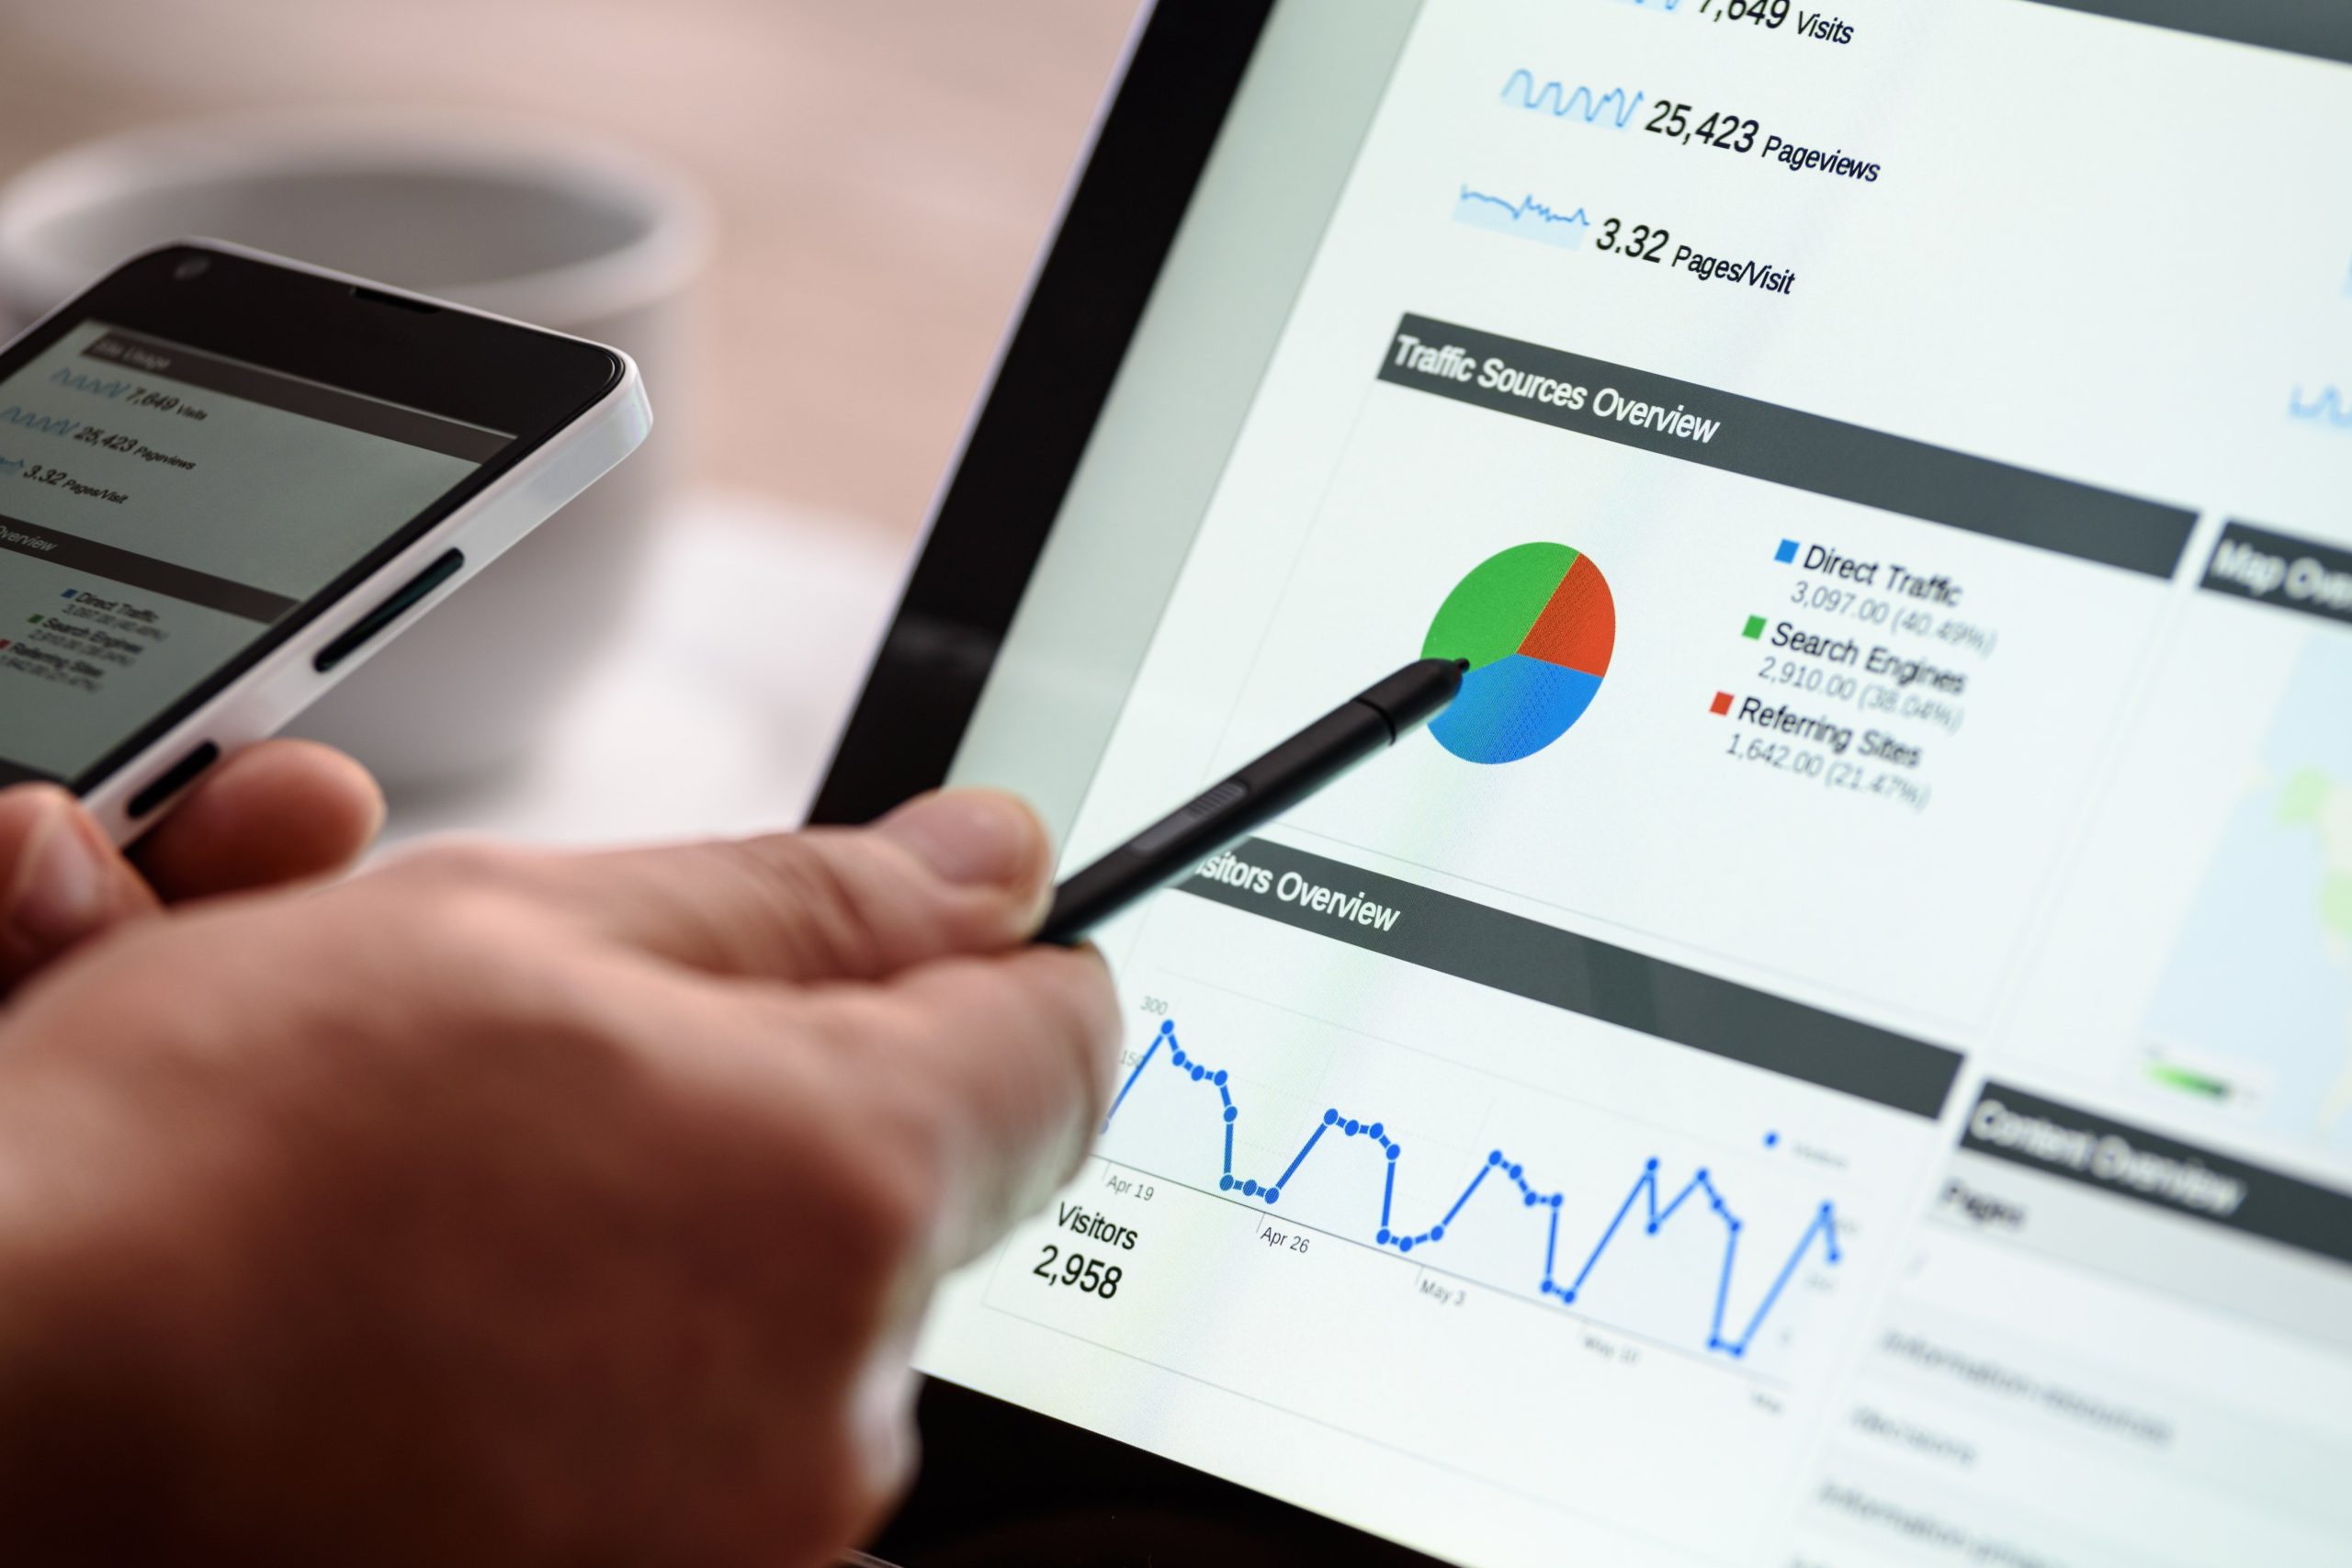
At the heart of data-driven UX lies analytics. Tools like Google Analytics, Hotjar, and Mixpanel capture a symphony of user interactions: clicks, scrolls, session durations, and drop-off points. Heatmaps reveal where eyes linger, while session recordings expose friction points invisible in static wireframes. For instance, an e-commerce site might discover that users abandon carts because a promo code field is hidden—a fix that boosts conversions by 20%.
But data’s true power emerges when paired with context. When Spotify noticed users skipping tracks within seconds, they didn’t just tweak algorithms—they analyzed listening contexts (workouts, commutes) to curate mood-based playlists. The result? A 35% increase in playlist engagement.
Balancing Numbers and Narratives
Quantitative data answers what; qualitative insights explain why. Surveys, interviews, and usability tests add depth to analytics. Airbnb famously combined A/B testing with user interviews to redesign its booking flow. Data showed a drop-off at the payment page, but interviews revealed users feared hidden fees. The solution? Transparent pricing upfront, which increased completed bookings by 15%.
This duality extends to accessibility. Tools like Crazy Egg track how users with screen readers navigate sites, while platforms like UserTesting gather feedback from neurodiverse audiences. By merging analytics with empathy, designers create inclusive experiences that cater to all.
From Insight to Action
A/B testing is the crucible where hypotheses meet reality. When Duolingo tested gamification elements, data revealed that users engaged more with streak counters than achievement badges. The team doubled down on streaks, driving a 10% rise in daily active users. Similarly, Netflix’s thumbnail A/B tests, which analyze millions of interactions, have refined their art to boost click-through rates by 30%.
Machine learning amplifies this process. Predictive analytics forecast user paths, enabling preemptive optimizations. Amazon’s recommendation engine, fueled by purchase history and browsing patterns, accounts for 35% of total revenue—a testament to anticipatory design.
Navigating the Pitfalls
Data overload looms as a risk. Without focus, teams drown in metrics, mistaking correlation for causation. The key is prioritization: identifying north star metrics (e.g., conversion rates, retention) that align with strategic goals.
Privacy is another tightrope. GDPR and CCPA demand transparency in data collection. Brands like Apple now let users opt out of tracking, pushing designers to innovate without overreliance on personal data. Anonymized aggregate data and federated learning offer paths forward, balancing personalization with privacy.
The Future: AI and Beyond
Emerging technologies are redefining data’s role in UX. AI-powered tools like FullStory auto-detect UX issues, suggesting fixes in real time. Meanwhile, eye-tracking VR prototypes map user attention in 3D spaces, offering insights for immersive design.
The next frontier is emotion analytics. Startups like Affectiva analyze facial expressions and voice tones to gauge user sentiment, enabling interfaces that adapt to frustration or delight. Imagine a banking app that simplifies its layout when detecting stress—a fusion of data and empathy.
Leave a Reply